


Latest Version
Version
1.0.50
1.0.50
Update
September 08, 2025
September 08, 2025
Developer
Proaktif Fırsatlar
Proaktif Fırsatlar
Categories
Tools
Tools
Platforms
Android
Android
Downloads
0
0
License
Free
Free
Package Name
com.proaktif.firsatlar
com.proaktif.firsatlar
Report
Report a Problem
Report a Problem
More About Proactive Opportunities
Explore chart patterns with a clean, educational interface. View pattern highlights across timeframes and customize filters to focus your analysis.
Highlights:
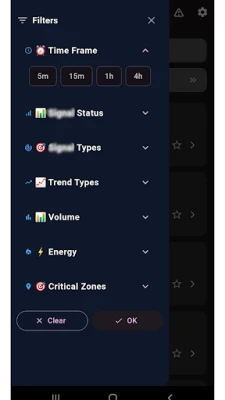
• Multi‑language UI and customizable filters
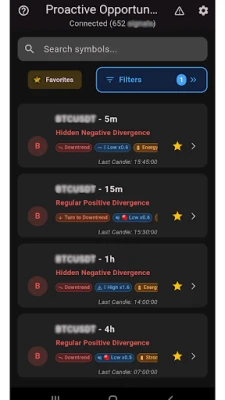
• Timeframe comparisons (5m–4h)
• Save favorites for quick access
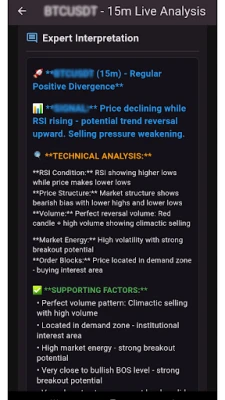
• Indicator summaries for volume, momentum and energy
• Privacy‑friendly design, no personal data collected
Purpose:
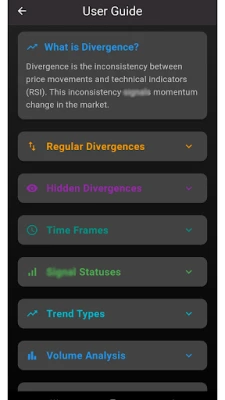
• Learn and practice visual chart analysis
• Understand patterns with clear summaries
Disclaimer:
This app is for educational use only and does not provide financial advice or trading instructions.
• Multi‑language UI and customizable filters
• Timeframe comparisons (5m–4h)
• Save favorites for quick access
• Indicator summaries for volume, momentum and energy
• Privacy‑friendly design, no personal data collected
Purpose:
• Learn and practice visual chart analysis
• Understand patterns with clear summaries
Disclaimer:
This app is for educational use only and does not provide financial advice or trading instructions.
Rate the App
Add Comment & Review
User Reviews
Based on 0 reviews
No reviews added yet.
Comments will not be approved to be posted if they are SPAM, abusive, off-topic, use profanity, contain a personal attack, or promote hate of any kind.


More »

Popular Apps

Resolution DPI Changer NO ROOTaBetterAndroid.

Story PlotterCreaterSupporter

MathPapa - Algebra CalculatorMathPapa, Inc.
Software EngineeringGhumman Tech

DPI CalculatorDuncan Leo

TALIONCom2uS Holdings

Characterize: Random GeneratorAlexander Winn

Linear Algebra Practice & PrepVarsity Tutors LLC

DPI Changer & Checker For GameProtection Apps

Microsoft Defender: AntivirusMicrosoft Corporation
More »
Editor's Choice

Hidden City: Hidden ObjectG5 Entertainment

Fairy Tales ~ Children’s BooksMATH GAMES FOR TODDLERS AND KIDS

Fairyland: Merge & MagicSlimmerbits LLC

Thingiverse Printables | 3DropHenryWu

Auction Bid Sniper for eBayMyibidder.com

Winner Blast: Wood BlockTamoloma Sutleomca

Github Repository BrowserLorenzo Valentijn

Food Street - Restaurant GameSupersolid

LSAT Prep 2025Pass Your Exam

AlteredEQUINOX CCG